
This event has passed.
Drive Better Decision Making with Data Visualization in Power BI
December 10, 2020 @ 1:00 pm - 1:30 pm EST
Drive Better Decision Making with Data Visualization in Power BI
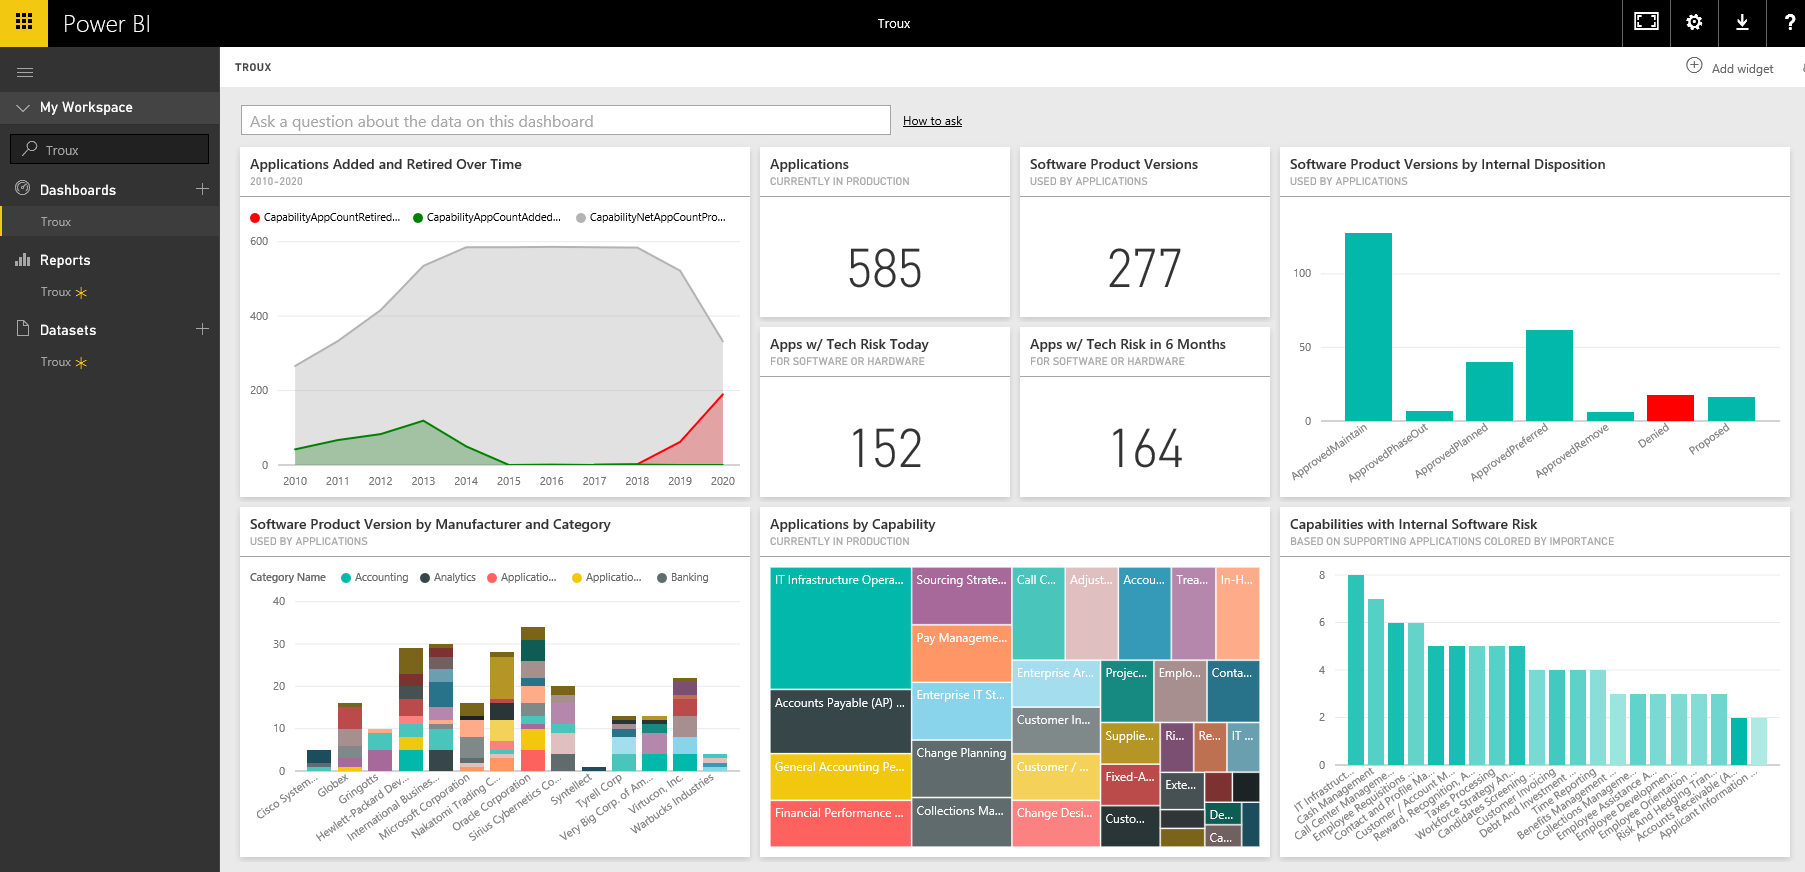
Data visualization brings your project data to life with live dashboards, interactive reports, charts, graphs, and more. Discover key business insight quickly and effectively giving you the power to make informed decisions and track trends over time. In this webinar learn how to use the library of fully customizable open source data visualization for Power BI.