At times, there is a preference to use color coding to highlight key items in a SharePoint list. The options below are completely done through the SharePoint user interface. In the end, there will be 3 options that can be leveraged for applying color coding into a SharePoint list.
- Option A – Leveraging default SharePoint site columns to determine which color will be used to highlight the values.
- Option B – Leveraging a formula within a SharePoint site column to provide key words that will determine which color will be used to highlight the values.
- Option C – Leveraging images, stored within the Site Assets library, that are targeted based upon a SharePoint formula to determine which color will be displayed.
Scenario: The default Project Site within Project Server 2013 contains a Risk library to manage project risks. The preference is to highlight High probability risks in Red (>75% Probability). To highlight Medium probability risks in Yellow (between 25% and 75%). All risks below 25% will be highlighted in green and considered a Low probability.
Here are the detailed configurations within SharePoint, Soup to Nuts.
Option A – Using a default SharePoint site column to determine the highlight color
Let’s begin within the Risk list, as a content library within the SharePoint project site. If you are leveraging a default Project Site within Project Server 2013, there is no configurations necessary on the SharePoint list. You can go directly down the Page HTML section below to provide a highlight of the background color, depending the risk probability percentage entered by the users.
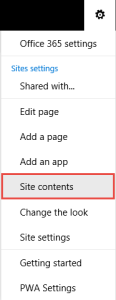
To start a new Risk list on a baseline Team Site template, click the site admin icon on the upper right corner and select Site Contents from the drop down list.
1. Within the Site Contents page, select the “Add an App” icon.
2. Within the list of available Apps, select the Custom List option from the library of Apps you can add.
3. Give the list a name of “Risks”and click
4. Within the Site Contents page, that now contains the new Risk list, select the new Risk list.
5. When the Risk list is opened, select the List tab and click the List Setting icon from the top ribbon.
6. Scroll down to the Columns section and click the Create column link.
7. Within the Create Column page, add the following items:
- Column Name: Probability
- Type of Information: Number
- Min and Max allowed values: Min: 1 and Max: 100
- Be sure to Show as percentage (for example, 50%)
- Add the Probability site column to the default view.
8. Click [OK] to create the site column.
9. Add the following Site Columns to the Risk List.
10. Once the new Risk List is created, navigate down to the Add the Script Editor section to highlight the Probability site column.
Option B – Establish a custom SharePoint site column to determine the highlight color
This options assumes you will leverage a default Project Site within Project Server 2013 that will contain a Risk library to manage project risks
1. Within the default Project Site, navigate to the Risks library.
2. Within the default Risks library, select the List tab and click the List Setting icon from the top ribbon.
3. Scroll down to the Columns section and click the Create column link.
4. Within the Create Column page, add the following items:
- Column Name: Risk Probability
- Type of Information: Calculated, enter the following formula:
| =IF(Probability>0.75,CONCATENATE((Probability*100),”%”,” High”),IF(Probability>0.25,CONCATENATE((Probability*100),”%”,” Medium”),CONCATENATE((Probability*100),”%”,” Low”))) |
- The results should be a single line of text
- Add the field to the default view.
5. Click [OK] to create the site column.
6. Once the new Risk Probability site column is created, navigate down to the Add the Script Editor section to highlight the Risk Probability site column.
Option C – Upload a series of images to provide the highlight color
This options assumes you will leverage a default Project Site within Project Server 2013 that will contain a Risk library to manage project risks.
1. Within the default Project Site, click the site admin icon on the upper right corner and select Site Contents from the drop down list.
2. Within the Site Contents page, select the Site Assets library.
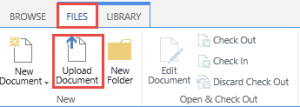
3. Within the Site Assets library, select the Files tab and click Upload Document.
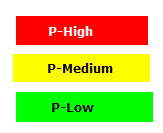
4. Select the [Browse] button and locate the first image that will be used to highlight the High probability risks.
5. Once the new image is selected, slick [Open] and [OK] to upload the first image.
6. Follow steps 4 & 5 to upload the Medium probability risk image and Low probability risk image.
7. When all of the images are uploaded, click the site admin icon on the upper right corner and select Site Contents from the drop down list.
8. Within the Site Contents page, select the Risks library.
9. Within the default Risks library, select the List tab and click the List Setting icon from the top ribbon.
10. Scroll down to the Columns section and click the Create column link.
11. Within the Create Column page, add the following items:
- Column Name: Risk Probability 2 (use a unique name)
- Type of Information: Calculated, enter the following formula:
| =”<div><img src='”&IF(Probability>0.75,”/sites/pwademo/00%20Create%20Site%20Test/SiteAssets/p-high.png”,IF(Probability>0.25,”/sites/pwademo/00%20Create%20Site%20Test/SiteAssets/p-medium.png”,”/sites/pwademo/00%20Create%20Site%20Test/SiteAssets/p-low.png”))&”‘ /></div>” |
* Within the formula, ensure the URL of the High, Medium, and Low risk image are incorporated. Within this scenario, the image location and names are:
- High Probability Image = “/sites/pwademo/00%20Create%20Site%20Test/SiteAssets/p-high.png”
- Medium Probability Image = “/sites/pwademo/00%20Create%20Site%20Test/SiteAssets/p-medium.png”
- Low Probability Image = “/sites/pwademo/00%20Create%20Site%20Test/SiteAssets/p-low.png”
REPLACE THESE IMAGE URLS TO ASSOCIATE THE FORMULA TO THE IMAGES LOADED IN STEPS 1-7 OF OPTION C.
- The results should be a single line of text
- Add the field to the default view.
12. Click [OK] to create the site column.
13. Once the new Risk Probability site column is created, navigate down to the Add the Script Editor section to highlight the Risk Probability site column.
Add the Script Editor
1. Navigate to the Risks library.
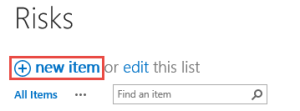
2. Within the Risks library, select the [New Item] option to create a new High probability risk (greater than 75% probability).
3. Within the Risk entry form, enter the Risk Title, Probability, and any other required fields.
4. Click [Save] to create the new risk item.
5. Repeat steps 2-4 to create a Medium and Low probability risk.
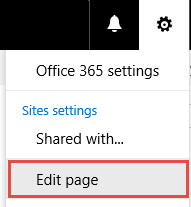
6. Within the Risks library page, select the Admin icon on the upper right corner and click Edit page.
7. Within the Page Edit mode, click the [Add a Web Part] button.
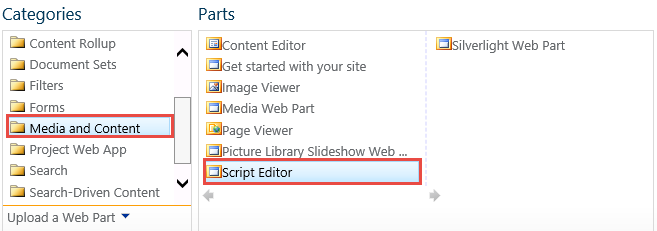
8. Scroll down the web part categories to the Media and Content category, select the Script Editor web part.
9. Select [Add] to add the Script Editor web part to the page.
10. Drag the Script Editor web part below the risks view within the Risks library.
11. On the right side of the Script Editor web part, click the EDIT SNIPPET link. The EMBED popup is presented.
12. Within the EMBED popup, add the following HTML to provide the valid background color on the probability (or Risk Probability) column or to display the uploaded images.
| <script src=”https://ajax.googleapis.com/ajax/libs/jquery/1.11.3/jquery.min.js”></script>
<script type=”text/javascript”> $(document).ready(function(){ ChangeColor(); HtmlRender(); }); //ChangeColor change the background color of probabilty and risk probability column data on basis of high value // function ChangeColor() { var probabilityCount=0; var riskProbabilityCount=0; var count=0;
$(“thead tr”).find(“th”).each(function(){ count=count+1; if($(this).text().trim()==”Probability”) { probabilityCount=count; } if($(this).text().trim()==”Risk Probability”) { riskProbabilityCount=count; } }); $(“tbody”).find(“.ms-itmHoverEnabled”).each(function(){ //Changing color by comparing the value if(parseFloat($(this).find(“td:nth-child(“+probabilityCount+”)”).text())>75) { $(this).find(“td:nth-child(“+probabilityCount+”)”).css(“background-color”,”red”); $(this).find(“td:nth-child(“+probabilityCount+”)”).css(“font-weight”,”bold”); } else if(parseFloat($(this).find(“td:nth-child(“+probabilityCount+”)”).text())>25) { $(this).find(“td:nth-child(“+probabilityCount+”)”).css(“background-color”,”yellow”); $(this).find(“td:nth-child(“+probabilityCount+”)”).css(“font-weight”,”bold”); } else if(parseFloat($(this).find(“td:nth-child(“+probabilityCount+”)”).text())>=0) { $(this).find(“td:nth-child(“+probabilityCount+”)”).css(“background-color”,”lime”); $(this).find(“td:nth-child(“+probabilityCount+”)”).css(“font-weight”,”bold”); } //Changing color by comparing the text if($(this).find(“td:nth-child(“+riskProbabilityCount+”)”).text().indexOf(“High”) >= 0) { $(this).find(“td:nth-child(“+riskProbabilityCount+”)”).css(“background-color”,”red”); $(this).find(“td:nth-child(“+riskProbabilityCount+”)”).css(“font-weight”,”bold”); } else if($(this).find(“td:nth-child(“+riskProbabilityCount+”)”).text().indexOf(“Medium”) >= 0) { $(this).find(“td:nth-child(“+riskProbabilityCount+”)”).css(“background-color”,”yellow”); $(this).find(“td:nth-child(“+riskProbabilityCount+”)”).css(“font-weight”,”bold”); } else if($(this).find(“td:nth-child(“+riskProbabilityCount+”)”).text().indexOf(“Low”) >= 0) { $(this).find(“td:nth-child(“+riskProbabilityCount+”)”).css(“background-color”,”lime”); $(this).find(“td:nth-child(“+riskProbabilityCount+”)”).css(“font-weight”,”bold”); } }); } // // ExpGroupRenderData overwrites the default SharePoint function // This part is needed for collapsed groupings // function ExpGroupRenderData(htmlToRender, groupName, isLoaded) { var tbody = document.getElementById(“tbod” + groupName + “_”); var wrapDiv = document.createElement(“DIV”); wrapDiv.innerHTML = “<TABLE><TBODY id=\”tbod” + groupName + “_\” isLoaded=\”” + isLoaded + “\”>” + htmlToRender + “</TBODY></TABLE>”; var theTBODYTDs = wrapDiv.getElementsByTagName(“TD”); var j = 0; var TDContent = ” “; while (j < theTBODYTDs.length) { try { TDContent = theTBODYTDs[j].innerText || theTBODYTDs[j].textContent; if ((TDContent.indexOf(“<DIV”) == 0) && (TDContent.indexOf(“</DIV>”) >= 0)) { theTBODYTDs[j].innerHTML = TDContent; } } catch (err) { } j = j + 1; } tbody.parentNode.replaceChild(wrapDiv.firstChild.firstChild, tbody); } // //HtmlRender render the html of table data which is within div tag // function HtmlRender(){ var theTDs = document.getElementsByTagName(“td”); var i=0; var TDContent = ” “; while (i < theTDs.length) { try { TDContent = theTDs[i].innerText || theTDs[i].textContent; if ((TDContent.indexOf(“<div”) == 0) && (TDContent.indexOf(“</div>”) >= 0)) { if(TDContent.match(‘>; <‘)){theTDs[i].innerHTML = TDContent.replace(new RegExp(/>; </g),’><‘);} else if(TDContent.match(‘>;<‘)){theTDs[i].innerHTML = TDContent.replace(new RegExp(/>;</g),’><‘);} else{theTDs[i].innerHTML = TDContent;} } } catch(err){} i=i+1; } } </script> |
13. When the HTML is added, click the [INSERT] button.
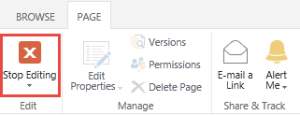
14. Select the [Stop Editing] button within the page ribbon.
15. Ensure the selected option is now displaying the background color or uploaded images, based upon the Risk probability.
** You may need to reset your browser cache to review the revised styles.
** You may need to make a slight adjustment to the view to see the colored results.








Leave A Comment
You must be logged in to post a comment.