Tracking Project Progress with Microsoft Power BI and Planner
In today’s fast-paced, data-driven work environment, project visibility and real-time tracking are essential. Microsoft Planner is a powerful tool for organizing tasks, but when combined with Power BI, it transforms into a comprehensive solution for project reporting and analytics. In this post, we’ll explore how integrating Microsoft Planner with Power BI can help project managers, team leads, and stakeholders gain deeper insights and make smarter, faster decisions.
Why Integrate Planner with Power BI?
Microsoft Planner makes it easy to assign tasks, set deadlines, and manage project boards. However, when it comes to analyzing trends, tracking progress over time, or consolidating data across multiple plans, Planner alone can fall short. Power BI fills this gap by enabling users to visualize project data through dynamic dashboards and custom reports.
Key Benefits of Using Power BI with Planner
-
Enhanced Project Visibility: Create visual timelines, task status heatmaps, and workload overviews to see the full picture at a glance.
-
Custom Reporting: Build tailored reports to highlight key performance indicators (KPIs), such as task completion rates, overdue tasks, and upcoming deadlines.
-
Data Consolidation: Easily combine data from multiple Planner boards across teams or departments.
-
Interactive Dashboards: Drill down into specific buckets, labels, or team members to investigate delays, identify bottlenecks, or analyze team productivity.
Getting Started: Connecting Planner to Power BI
There are a few ways to connect Microsoft Planner to Power BI:
-
Using Microsoft Graph API: This approach allows access to detailed Planner data, such as tasks, assignments, and progress. With some setup and scripting (often through Power Automate or a custom connector), you can create a robust data pipeline.
-
Power Automate Flows: Automate the collection of Planner data into a SharePoint list or Dataverse, which Power BI can easily query.
-
Third-party Connectors: Some services and templates simplify integration without requiring coding.
Once connected, Power BI can pull your Planner data and refresh dashboards automatically, ensuring your team always has access to the most up-to-date project insights.
Building Dashboards That Matter
When designing dashboards, think about what your stakeholders need to know. Here are a few examples:
-
Team Overview Dashboard: Display current workloads, task distribution, and project health by team member.
-
Timeline View: Visualize tasks across a Gantt-style timeline to monitor schedule alignment.
-
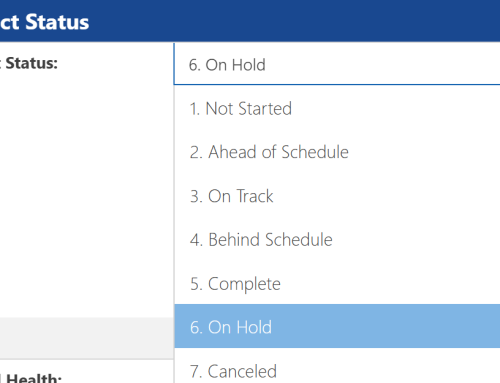
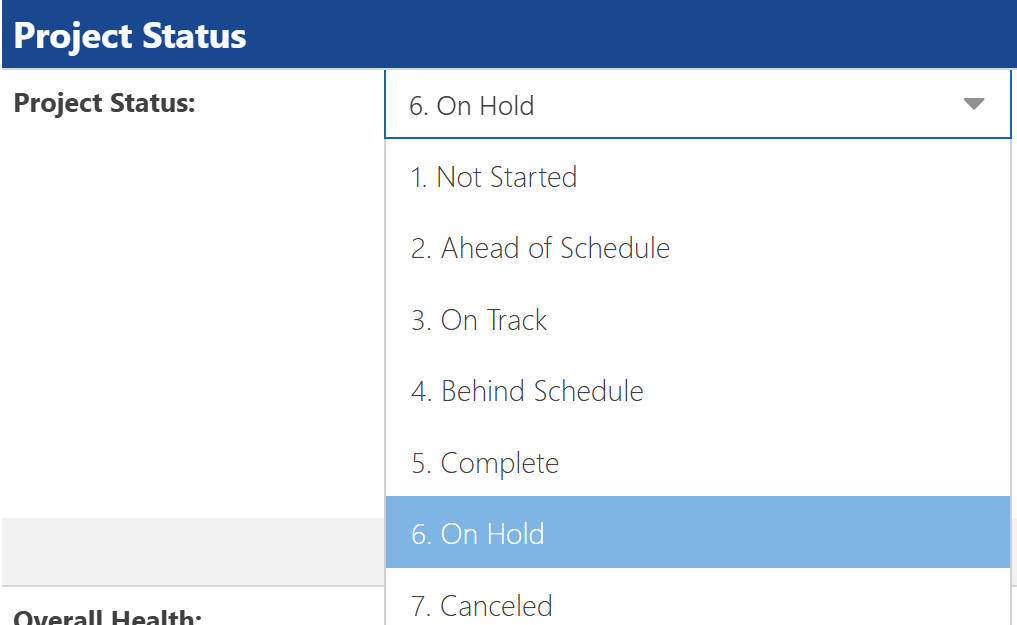
Status Summary Report: Highlight the count of tasks by status (Not Started, In Progress, Late, Completed).
-
Trend Analysis: Track changes over time, such as task velocity or completion rates per sprint.
Real-World Use Cases
-
Project Managers can monitor high-level progress and drill into late or at-risk tasks.
-
Executives can view roll-up dashboards across departments for strategic decision-making.
-
Team Leads can balance workloads and identify areas for support or resourcing.
Final Thoughts
The combination of Microsoft Planner and Power BI offers a powerful way to transform static task lists into actionable project insights. Whether you’re managing a single team or overseeing enterprise-wide initiatives, integrating these tools helps bring clarity, accountability, and agility to your project workflows.
Ready to take your project reporting to the next level?
Consider setting up a free trial of OnePlan or reach out to PPM Works for expert help in building Power BI dashboards that work for your team.


