Displaying Multiple Baseline in a Gantt View
PPM Works is happy to share a helpful tip on how to create multiple baseline bars in a Gantt Chart view.
The first step is to set the initial baseline, also known as Baseline 0. If your organization has a business rule to set a new baseline after each stage gate, the Project Manager will then select Baseline 1 to capture Stage Gate 1’s baseline and so on. The original baseline is not over written.
The purpose for displaying this information on the Gantt Chart is to empower the Project Manager in identifying what stage the project began slipping. The Project Manager can compare how the project is tracking against the original baseline and also how each stage gate is tracking compared to both the original baseline and the previous Stage Gate baseline. There is a limitation to 4 baseline bars.
To display the additional baseline bars:
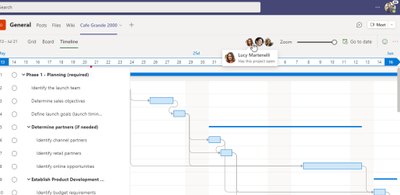
- Navigate to a Gantt Chart view
- Select the Format ribbon
- Select Format
Bar Styles

- Select Insert Row
- Type in the Name of the baseline
- Select the Shape, Pattern, and Color for the new bar
- Enter Normal in the Show For ……Tasks column (Note: It you enter additional task info such as critical, the bars will not appear)
- Change the Row number from #1 so it will be visible (Note: The limitation of 4 rows)
- Enter the Baseline Start and Finish for the appropriate baseline number

Click OK.

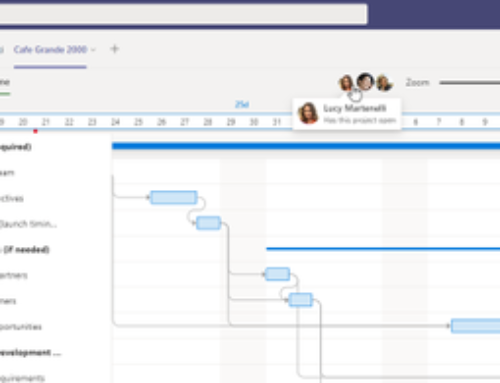
There is a built in view named Multiple Baselines Gantt. I find it difficult to distinguish which baseline is represented on each bar.

I will let you decide which you prefer. It’s nice to have options.
Find this helpful? Make sure to email Subscribe to our Blog

